SEDGIS (NEDA XI)
June 1, 2023
React · Material UI · GIS · REST APIs
Context
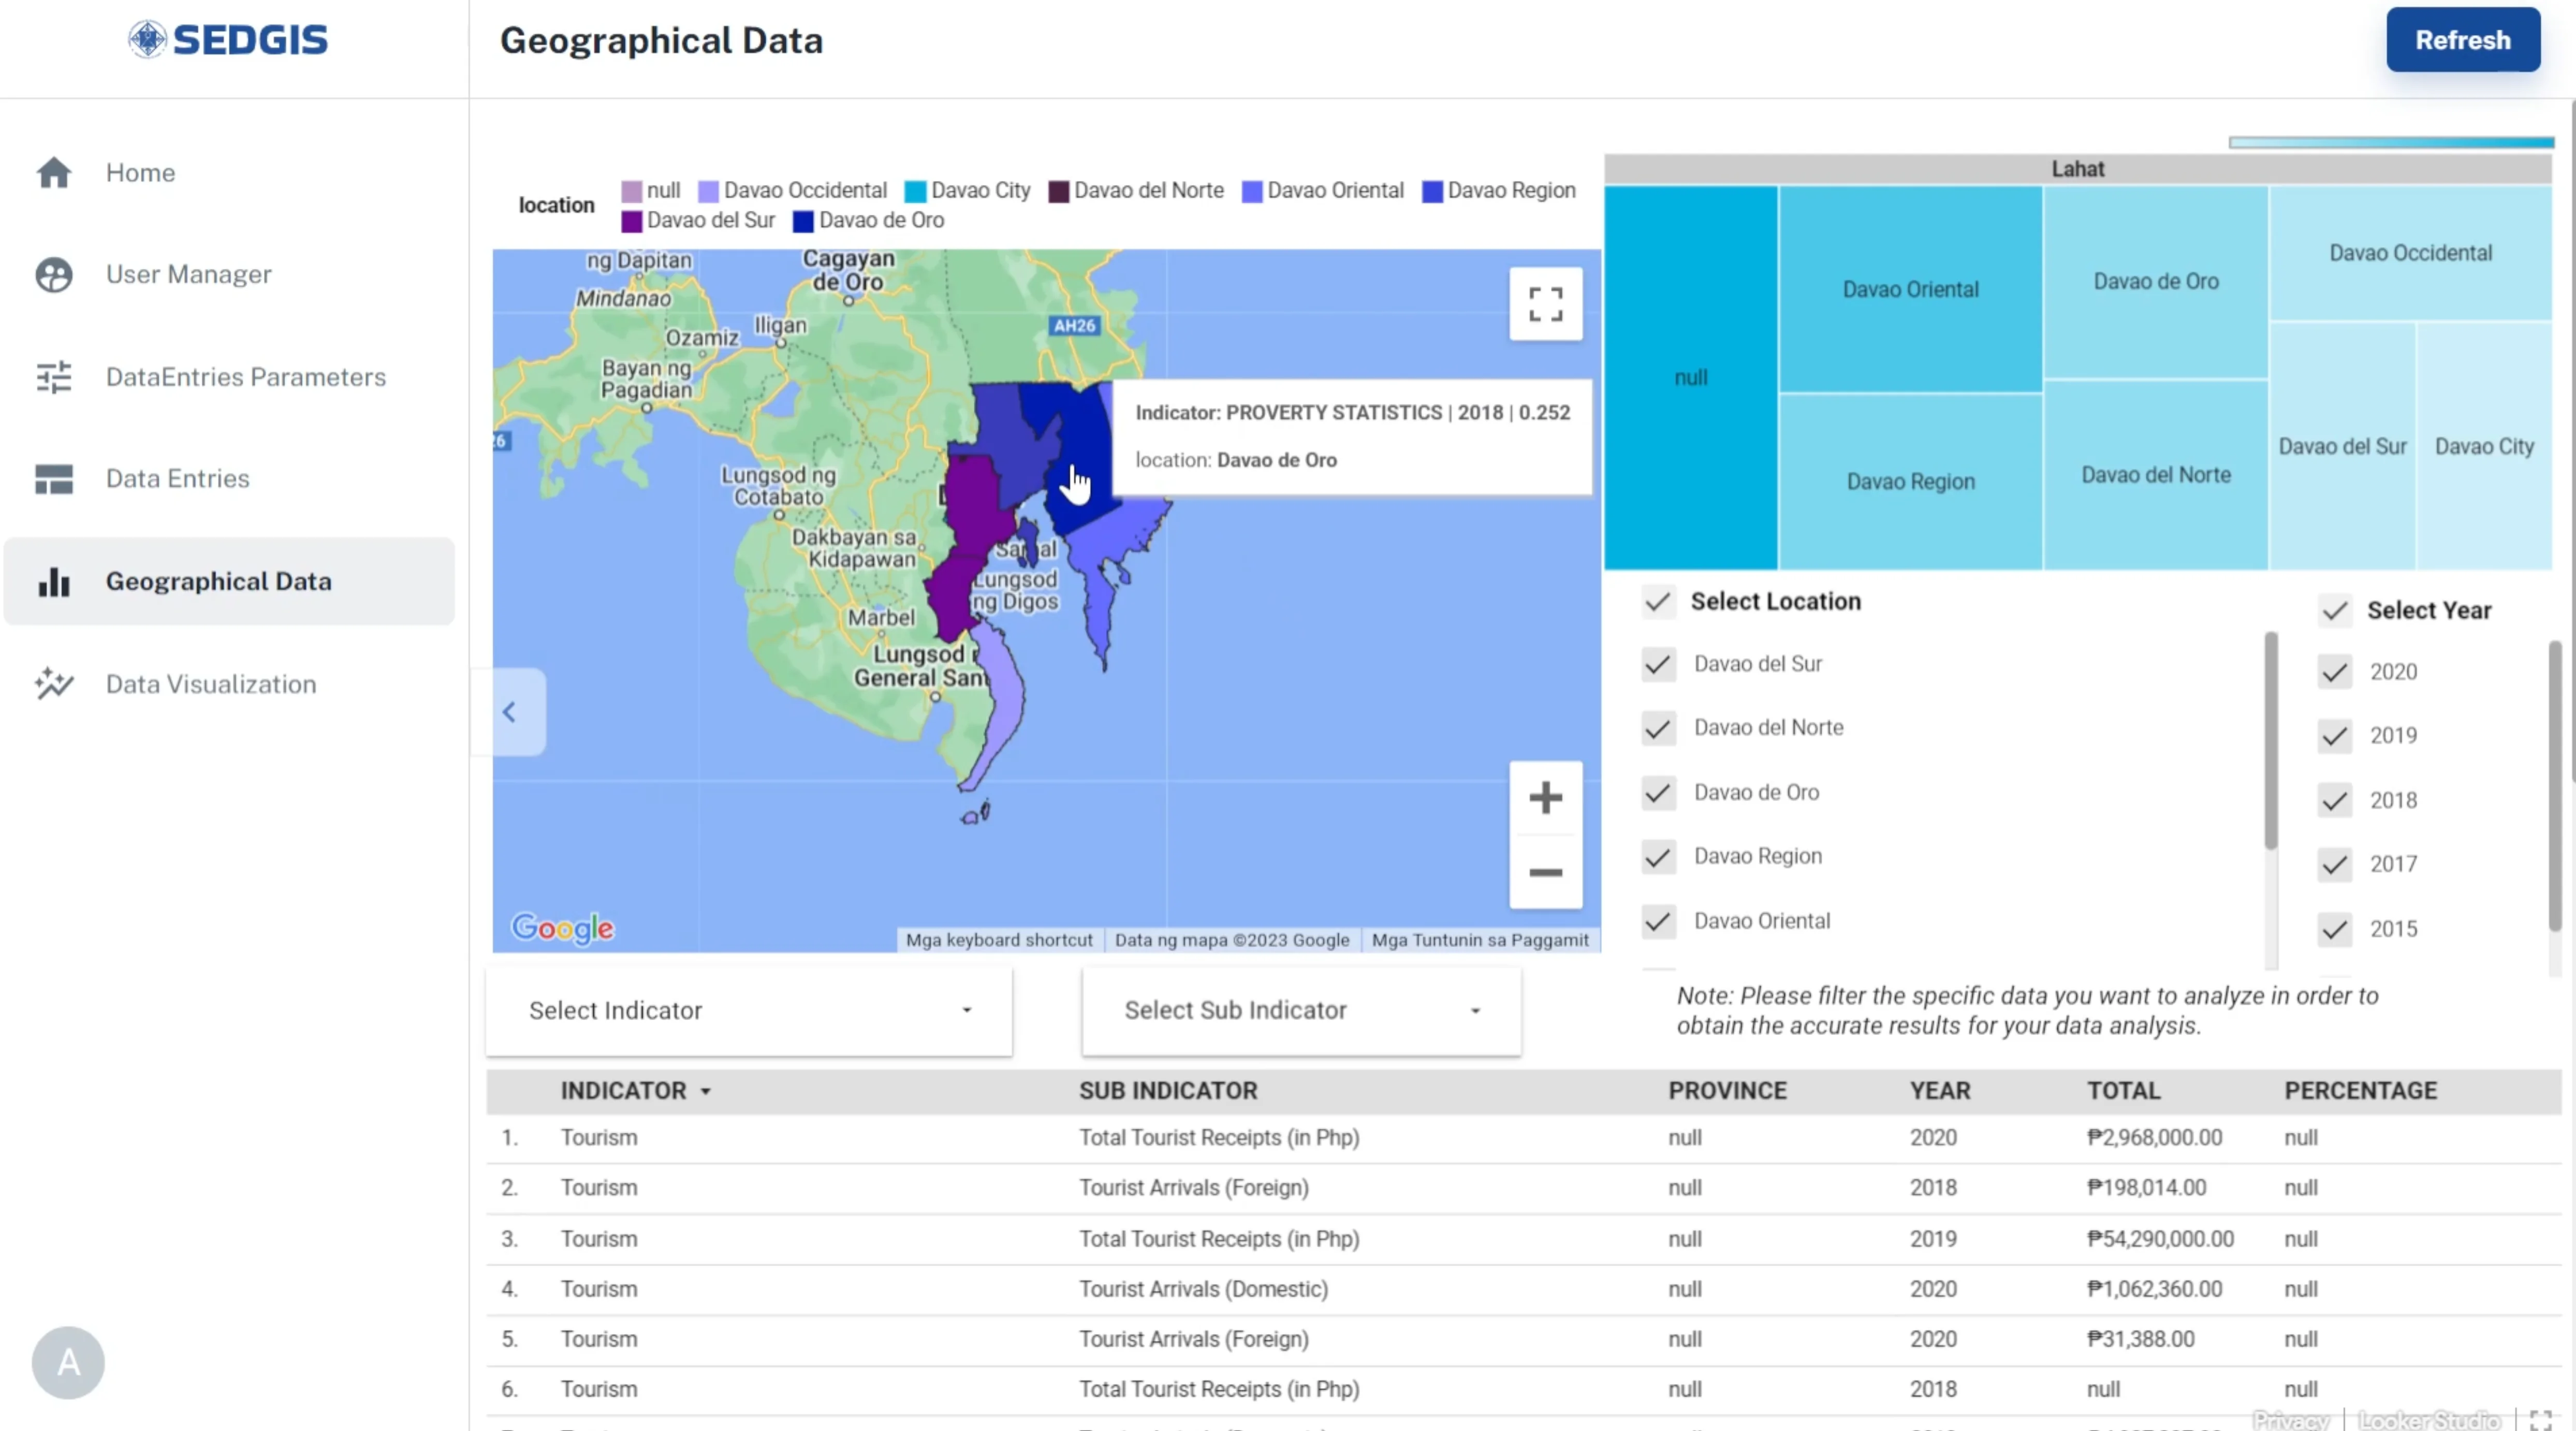
During my internship at NEDA XI (National Economic and Development Authority), I helped build a Socio-Economic Database with GIS, a government-facing tool for exploring regional indicators on a map, not just in tables.
What I built
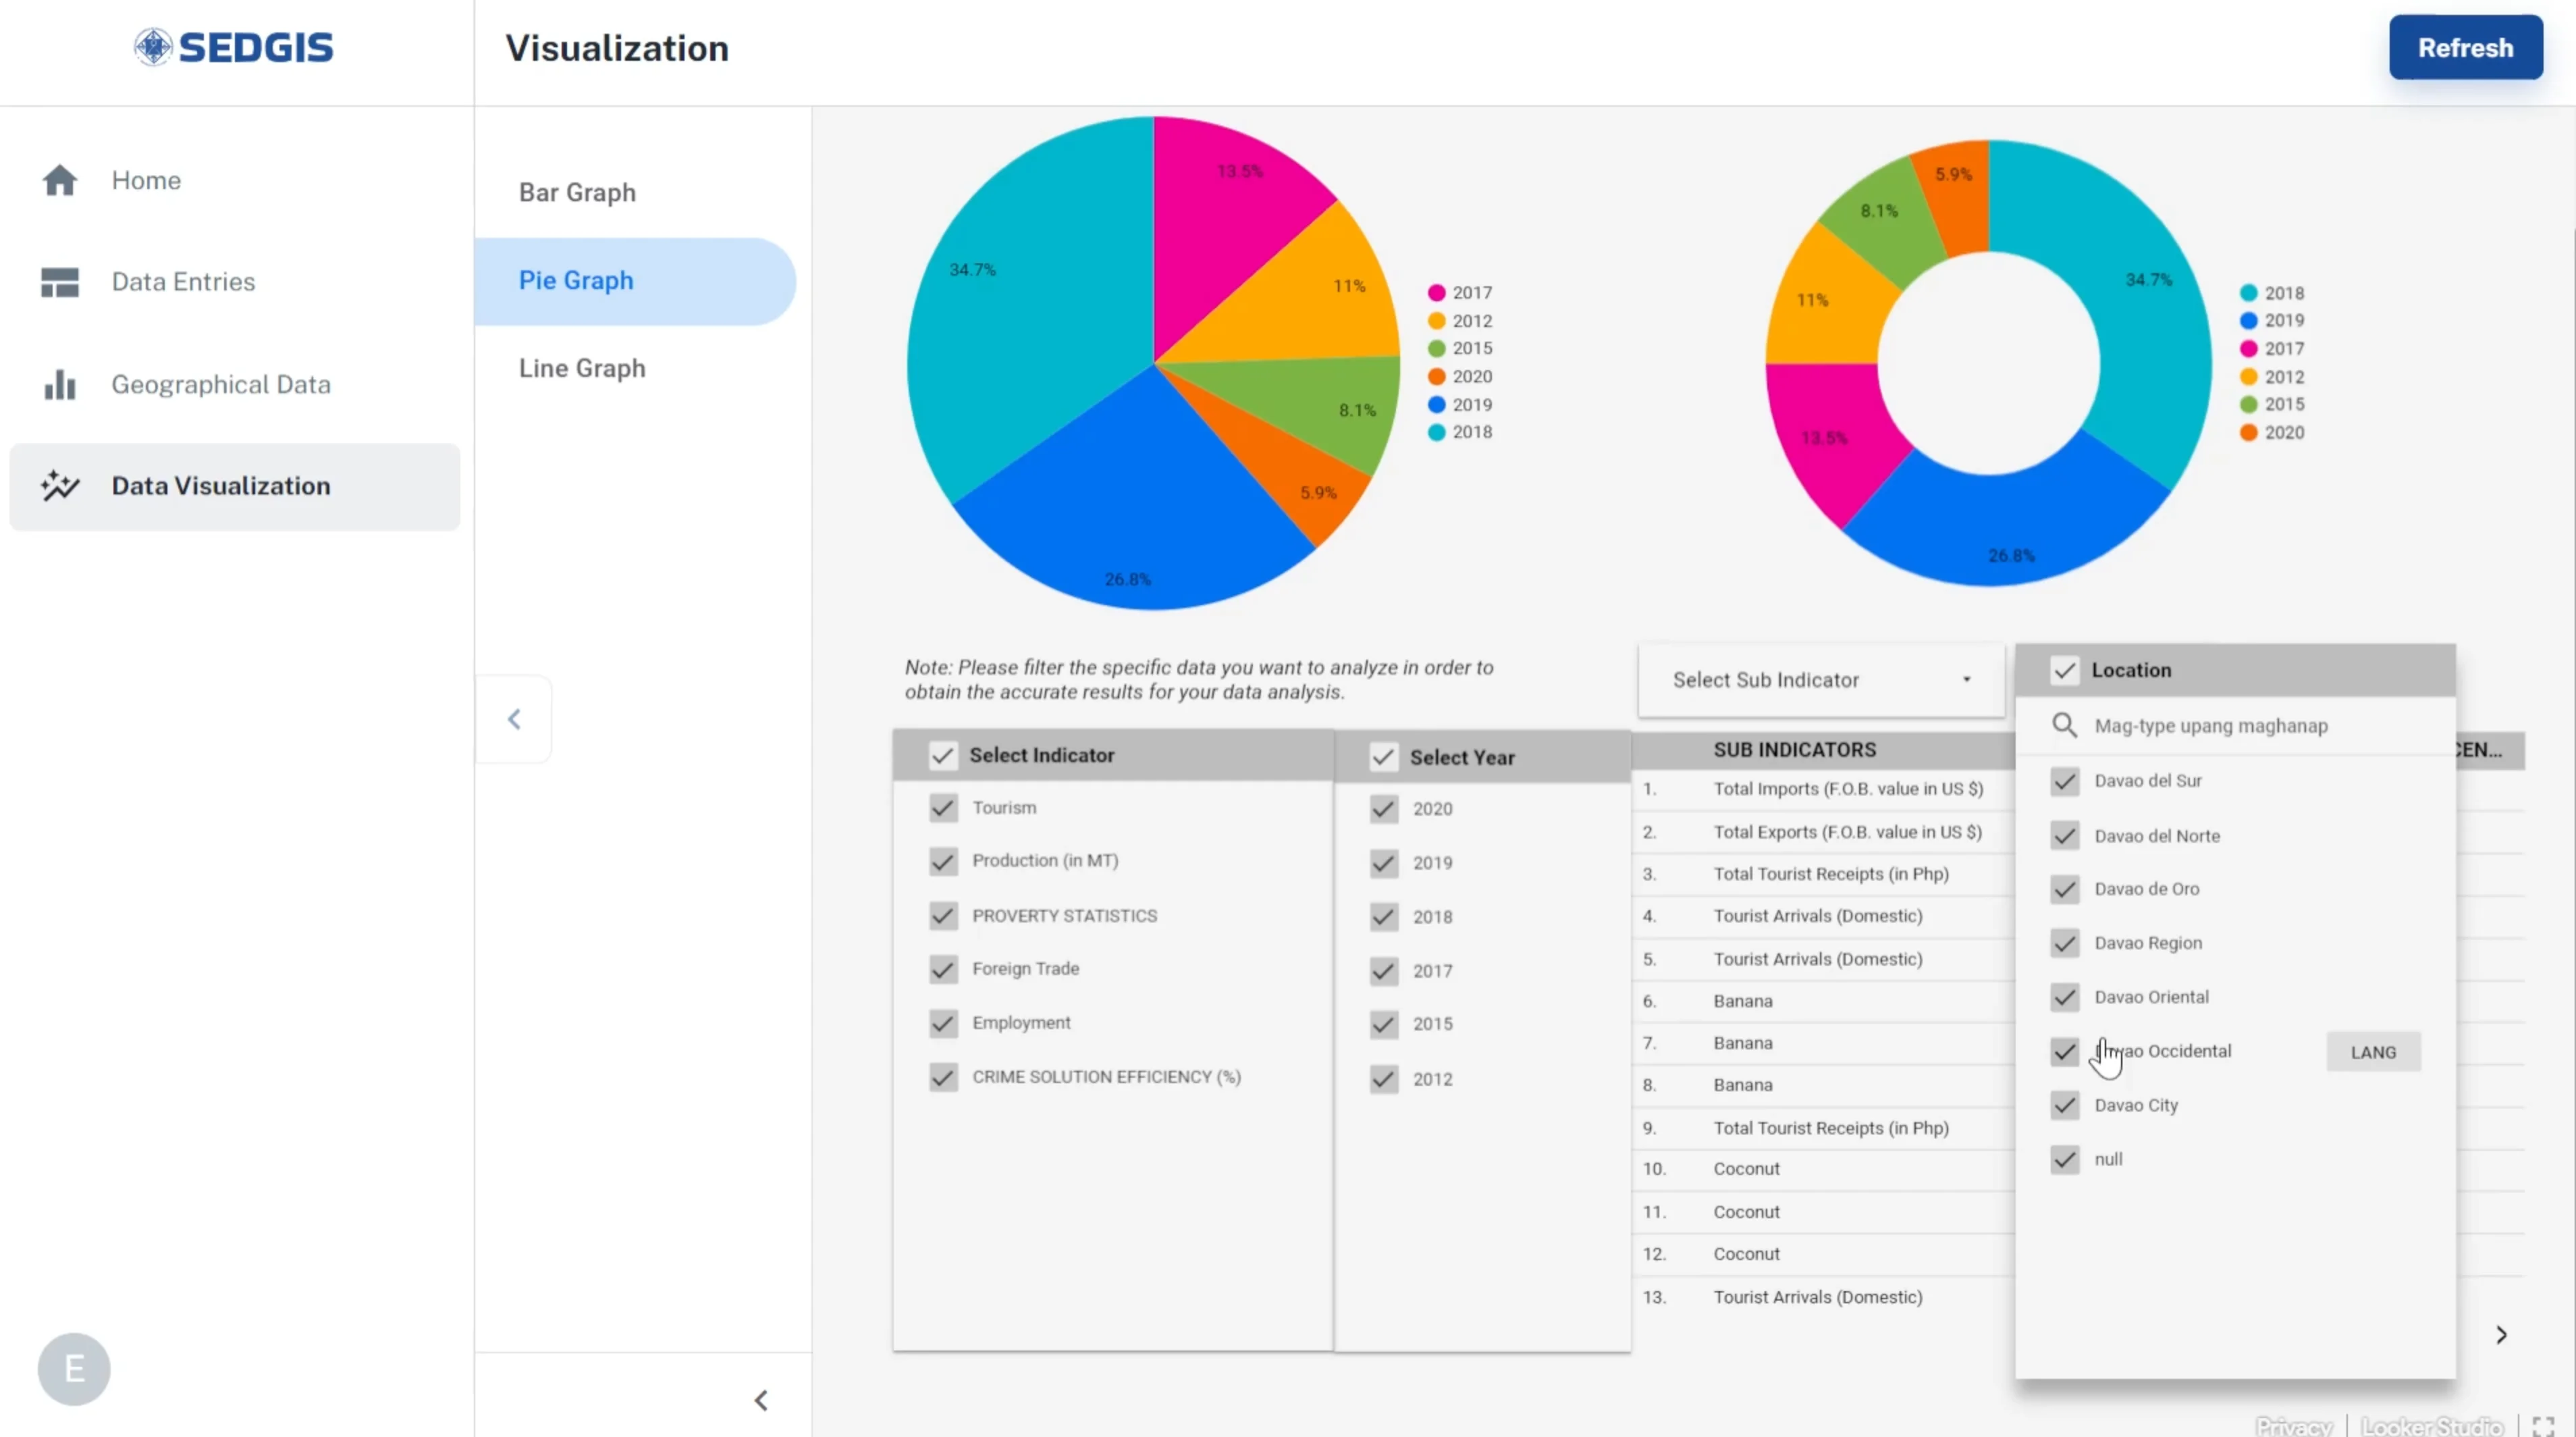
- React + Material UI interfaces for interactive charts and filters
- GIS-integrated views tying tabular socio-economic data to geography
- Components aimed at civil servants and analysts, not developers. Clarity over flash.
Technical highlights
The UX challenge was trust and legibility: users needed to compare provinces, drill into indicators, and still feel confident in the source data. I focused on consistent MUI patterns, accessible contrast, and layouts that survived long sessions of policy research.
Outcome
A capstone-adjacent public-sector project that combined my React skills with real institutional requirements, and reinforced why good front-end work is part civic service, not only consumer apps.